ENVIRONMENT
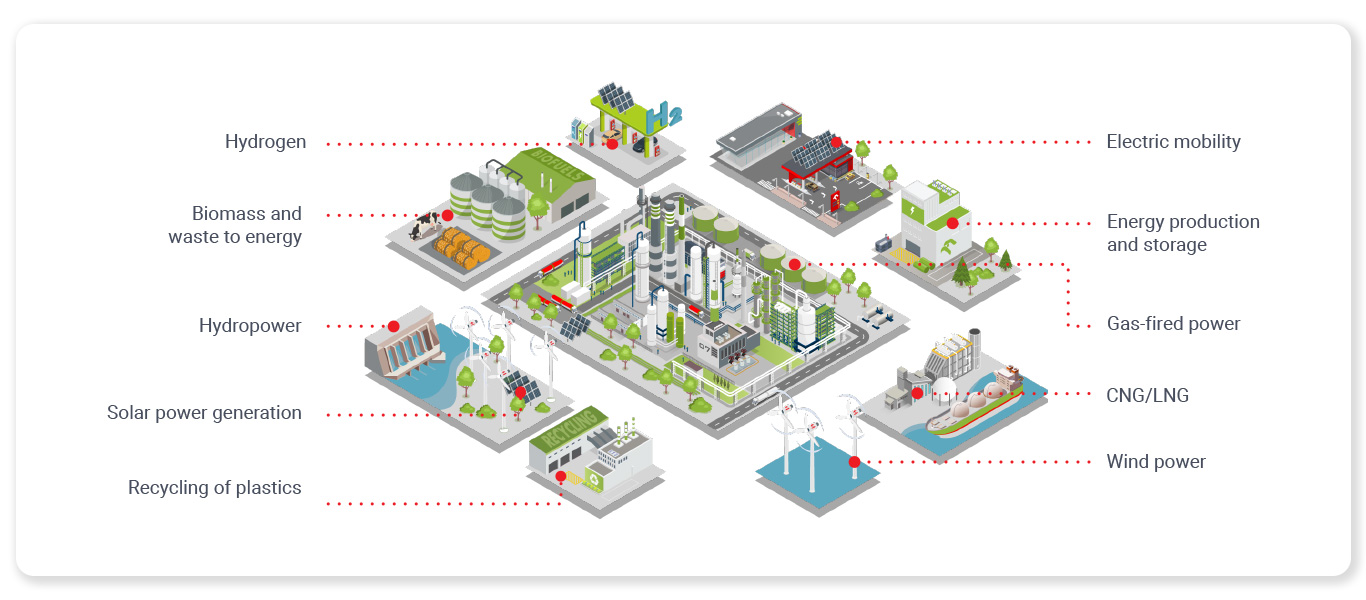
The ORLEN Group uses renewable and non-renewable natural resources in its operations. All our business activities are carried out in a responsible manner, with due consideration to the effects of current and future environmental impacts.
In production processes we use renewable resources (air, water, esters, bioethanol) and non-renewable ones (crude oil, natural gas and auxiliary chemicals).
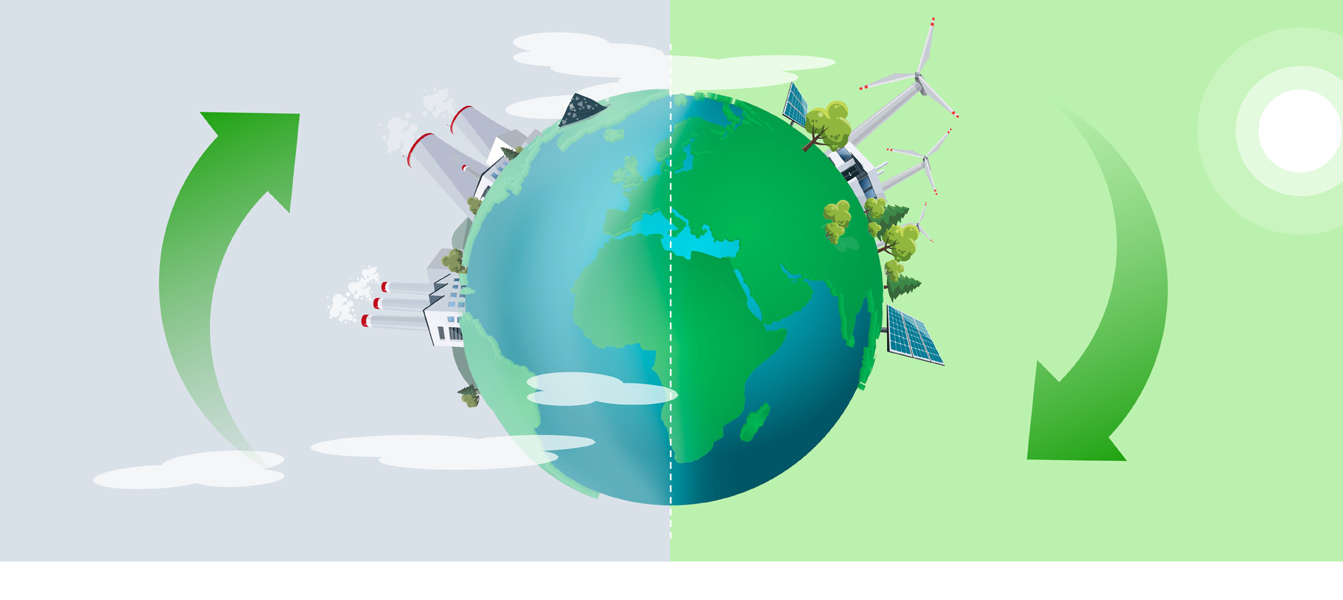
We take care to ensure that our production processes are environmentally friendly: our projects involved adaptation of plant and process units to new environmental requirements and standards defined in the EU regulations and BAT Conclusions. Those efforts include also administrative work to have the terms of the integrated permits for the Group’s plants amended, as well as capex projects related to the production plant and equipment.
Our approach to environmental protection management is based on the principles of corporate social responsibility and takes into account environmental criteria. We aim for sustainable development and we report the results of our environmental protection efforts. Our environmental objectives are set out in the Integrated Management System Policy.
Our activities are carried out based on the Integrated Management System, which includes:
- The Quality Management System (ISO 9001: 2015, AQAP 2110),
- Environmental Management System (ISO 14001:2015),
- Occupational Health And Safety Management System (ISO 45001),
- Information Security Management System (ISO/IEC 27001),
- Energy Management System (ISO 50001),
- Certification System for Biomass and Biofuels ISCC,
- KZR INiG certification system for the HVO process,
- Factory Production Control System (ZKP) – for bitumen production,
- Food Safety Management System (HACCP) according to Codex Alimentarius.
PKN ORLEN has valid certificates of compliance with ISO 9001: 2015, AQAP 2110, ISO 14001:2015, ISO 45001, ISO/IEC 27001, ISO 50001, Biomass and Biofuel Certification System (ISCC), Sustainability Certification System for Biomass and Biofuels (KZR INiG) and Factory Production Control System (ZKP).
These systems meet the highest international management standards and support the Company’s day-to-day efforts to ensure professional customer service and maintain top quality, safety, health protection and environmental standards. The key ORLEN Group companies have Integrated Management Systems in place, which include an Environmental Management System implemented and maintained in accordance with the ISO 14001 standard as their integral part. The Group companies also follow Integrated Management System/ Environmental Management System Policies, providing for an obligation to protect the environment, which includes pollution prevention and other specific obligations relevant to the operations of individual companies. These policies also include a requirement to comply with the law and other external and internal requirements.
For key policies and procedures governing climate and environmental protection issues at the ORLEN Group, see ‘Policies and internal regulations’ ; for further information on the projects implemented in 2020, see ‘Climate responsibility’.
This Integrated Report also describes initiatives and metrics for key climate and environmental impact aspects, such as water and wastewater management , atmospheric emissions (including GHG emissions), waste, capital expenditure on environmental protection, environmental complaints, number and weight of significant spills. This Report presents the Group’s approach to energy management, information on raw materials and production processes, environmental and climate impact risks and the mitigation measures.
With regard to the foregoing, PKN ORLEN has in place a dedicated procedure to be followed in emergency situations and respects the obligations to notify the relevant services. The Emergency Manual defines the procedure for appointment and operation of Technical Teams and Emergency Teams, as well as the method of calculating losses resulting from an emergency event.
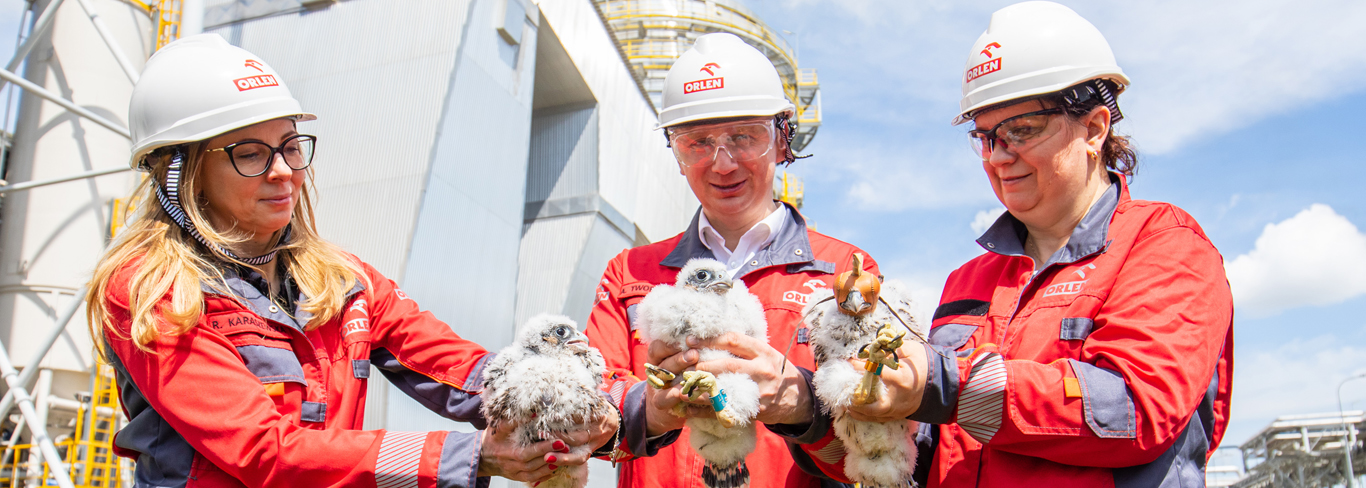
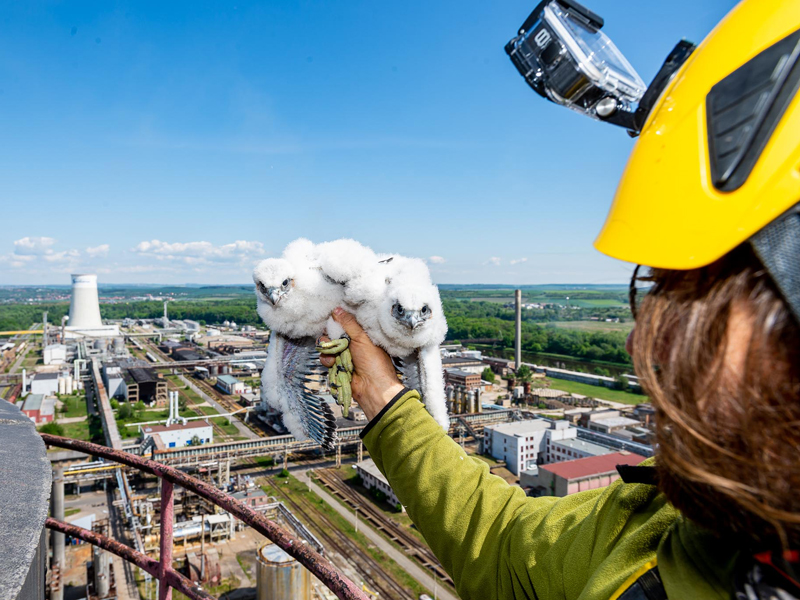
The ORLEN Group initiates educational projects aimed at raising the environmental awareness of its stakeholders. Group companies take part in initiatives such as protecting peregrine falcons, fish stocking of rivers, cleaning of waterfront areas, and beekeeping in the vicinity of production plants. For more information, see ‘Biodiversity protection’.
Water
Waterrecirculation
Waste
Transferof waste
Effluents
Enviromentalfees and charges
Capital expenditureon environmental protection
Penalties for non-compliance withenvironmental regulations
Complaints
Significantspills
Use of biocomponentsmeeting sustainably criteria
Energy consumptionwithin the organisation****
|
Description
|
2020 |
2019 |
2018 |
2017 |
GRI indicator |
||||
|
Value |
Value |
Value |
Value |
Value |
Value |
Value |
Value |
GRI 302-1 |
|
|
Energy consumption in fuels |
121,220,075 |
33,672,243 |
98,769,007 |
27,435,835 |
84,187,991 |
23,385,553 |
83,280,501 |
23,133,472 |
|
|
Electricity consumption |
2,268,361 |
630,100 |
2,304,094 |
640,026 |
2,211,043 |
614,179 |
2,187,400 |
607,611 |
|
|
Heat consumption |
4,221,813 |
1,172,726 |
5,579,603 |
1,549,890 |
6,825,492 |
1,895,970 |
6,252,290 |
1,736,747 |
|
|
Electricity sold |
47,609,725 |
13,224,924 |
33,938,256 |
9,427,293 |
24,984,321 |
6,940,089 |
24,786,031 |
6,885,009 |
|
|
Heat sold |
38,533,070 |
10,703,631 |
36,321,662 |
10,089,351 |
34,012,153 |
9,447,820 |
35,262,356 |
9,795,099 |
|
|
Total consumption***** |
35 077,280 |
9,743,689 |
28,509,089 |
7,919,191 |
25,191,517 |
6,997,644 |
23,232,114 |
6,453,365 |
|
**** Total consumption is calculated as the difference between each unit’s consumption of energy in fuel and energy sold to external and internal customers.
*****Reported since 2017
Installed capacity,broken down by primary energy source
| Description | 2020 | 2019 | 2018 | 2017 | 2016 | 2015 | GRI indicator | |
| Mwe (electrical capacity) | MWt (thermal capacity) | |||||||
| Natural gas | 1,027.6 | 1,530.32 | Measured since 2020 | GRI G4 EU1 | ||||
| Fuel oil/natural gas | 522.5 | 3,252 | ||||||
| Hard coal | 673.31 | 569.46 | ||||||
| Lignite | 141.5 | 1,258.4 | ||||||
| Biomass-fired generation unit | 25 | 30 | ||||||
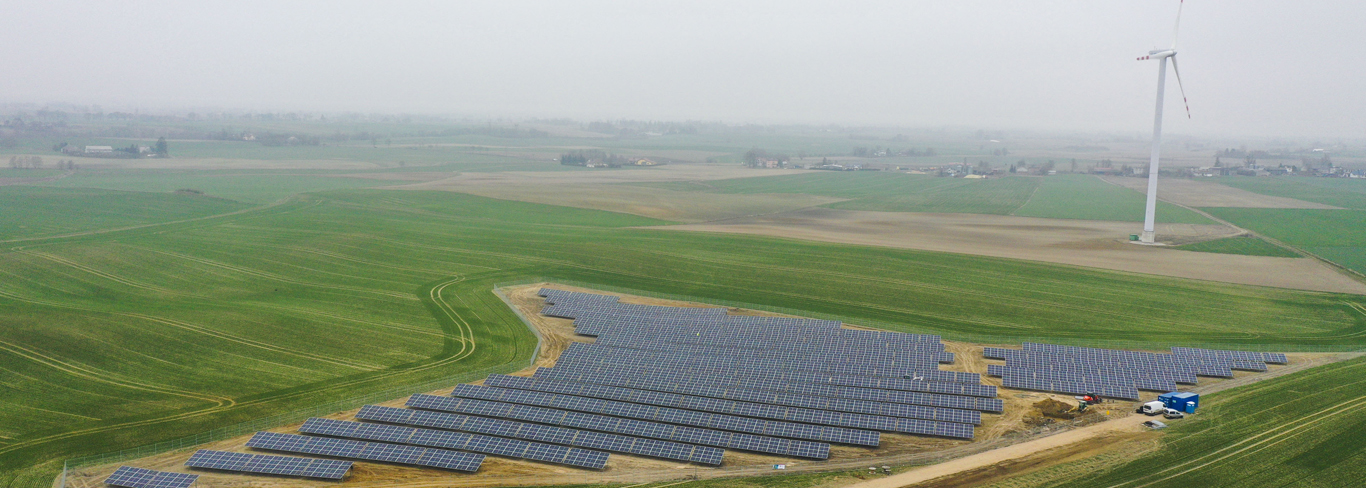
| Wind power plants | 359.29 | 0 | ||||||
| Solar power plants | 5.41 | 0 | ||||||
| Hydroelectric power plants | 243.85 | 0 | ||||||
| Power plants | 608.55 | 0 | ||||||
| CHP plants | 2,389.91 | 6,578.22 | ||||||
| Heat plants | 0 | 61.96 | ||||||
Net energy outputbroken down by primary energy source
| Description | 2020 | 2019 | 2018 | 2017 | 2016 | 2015 | GRI indicator | |
| Electricity [MWh] | Heat [GJ] | |||||||
| Natural gas | 6,808,582 | 6,139,229 | Measured since 2020 | GRI G4 EU2 | ||||
| Multi-fuel units (fuel oil/natural gas) | 1,640,215 | 23,268,178 | ||||||
| Lignite | 1,212,232 | 5,471,943 | ||||||
| Hard coal* | 2,728,751 | 3,653,720 | ||||||
| Wind farms | 338,366 | none | ||||||
| Solar power generation | 3,373 | none | ||||||
| Hydroelectric power plants | 493,405 | none | ||||||
* Since it is not possible to present separately electricity generated from biomass and the type of unit, electricity generated by biomass combustion installations is included in energy generated from hard coal.
Average generation efficiency of CHP plantsby energy source
|
Description |
2020 |
2019 |
2018 |
2017 |
2016 |
2015 |
GRI indicator |
|
Efficiency of electricity generation |
39.73% |
Measured since 2020 |
GRI G4 EU11 |
||||
|
Total generation efficiency of thermal plants (%) |
71.70% |
||||||
|
Efficiency of electricity generation |
|||||||
|
Fuel oil |
14.59% |
||||||
|
Lignite |
32.53% |
||||||
|
Natural gas |
48.52% |
||||||
|
Hard coal* |
66.79% |
||||||
|
Efficiency of electricity generation |
32.76% |
||||||
|
Efficiency of electricity generation |
83.23% |
||||||
*Since it is not possible to present separately electricity generated from biomass and the type of unit, electricity generated by biomass combustion installations is included in energy generated from hard coal