SAFETY
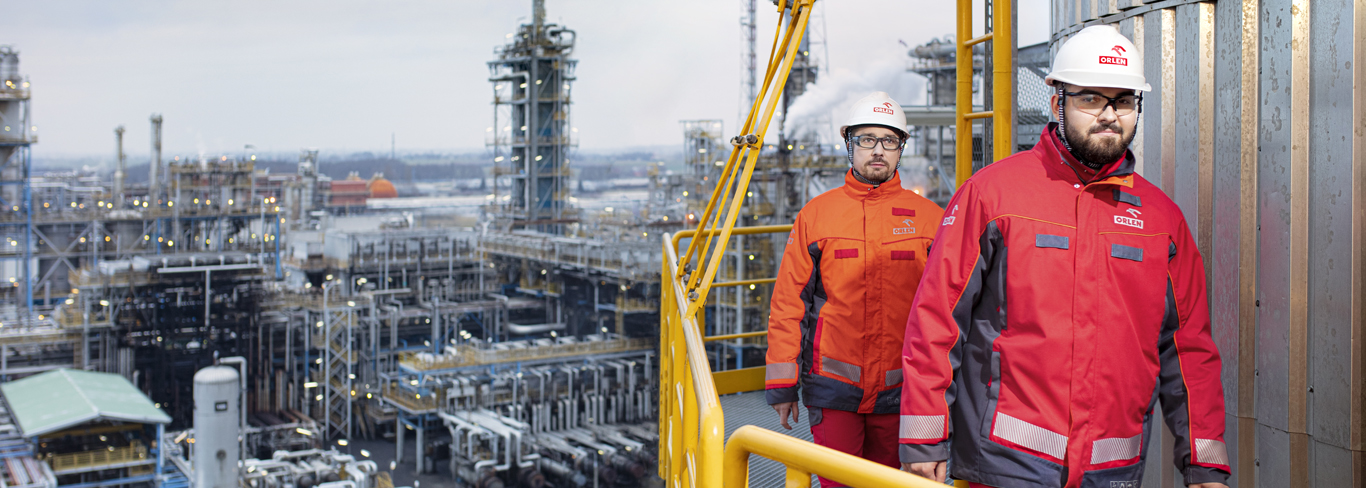
Care for the health and personal safety of employees and other stakeholders is an integral part of our organisational culture and business. In practice, this means that the Group does everything it can to prevent accidents, industrial failures, fires and other unwanted incidents.
For information on key policies and procedures governing occupational health and safety at the ORLEN Group, see ‘Policies and internal regulations’ .
Combined Total Recordable Rate (TRR)for employees and contractors*
TRR forORLEN Group employees** by gender
TRR forORLEN Group employees by region
Accidentsat work
| Description | UoM | 2020 | 2019 | 2018 | 2017 | 2016 | 2015 | GRI Indicator | |||||||||||
| Women | Men | Women | Men | Women | Men | Women | Men | Women | Men | Women | Men | ||||||||
| Total number of accidents at work involving ORLEN Group employees*** | number | 4 | 78 | 7 | 41 | 4 | 38 | 5 | 42 | 3 | 42 | 4 | 40 | GRI 403-9 | |||||
| Total number of accidents at work involving ORLEN Group contractors**** | number | 6 | 17 | 16 | 17 | 18 | 32 | 10 | 24 | 10 | 19 | 10 | 18 | ||||||
| Total number of accidents at work involving ORLEN Group employees and contractors | number | 10 | 95 | 23 | 58 | 22 | 70 | 15 | 66 | 13 | 61 | 14 | 58 | ||||||
***Number of accidents at work involving ORLEN Group employees which were acknowledged by the employer and were the direct cause of the injured employee’s taking sick leave.
****Number of acknowledged accidents at work involving employees of the ORLEN Group’s contractors who performed work for a Group company on premises owned or leased by a Group company, which accidents were the direct cause of the injured employee’s taking sick leave. The definition of ‘contractor’ covers also employees of the PKN ORLEN service stations.
| Description | UoM | 2020 | 2019 | 2018 | 2017 | 2016 | 2015 | GRI Indicator | |||||||||||||||||||||||||
| Poland | Czech Republic | Lithuania | Germany | Canada | Poland | Czech Republic | Lithuania | Germany | Canada | Poland | Czech Republic | Lithuania | Germany | Canada | Poland | Czech Republic | Lithuania | Germany | Canada | Poland | Czech Republic | Lithuania | Germany | Canada | Poland | Czech Republic | Lithuania | Germany | Canada | ||||
| Total number of accidents at work involving ORLEN Group employees* | number | 63 | 15 | 4 | 0 | 0 | 33 | 13 | 0 | 2 | 0 | 27 | 13 | 2 | 0 | 0 | 30 | 14 | 3 | 0 | 0 | 36 | 7 | 2 | 0 | 0 | 25 | 16 | 3 | 0 | 0 | GRI 403-9 | |
| Total number of accidents at work involving ORLEN Group contractors** | number | 17 | 6 | 0 | 0 | 0 | 28 | 4 | 0 | 1 | 0 | 29 | 17 | 3 | 0 | 1 | 29 | 4 | 1 | 0 | 0 | Reported since 2017 | |||||||||||
| Total number of accidents at work involving ORLEN Group employees and contractors | number | 80 | 21 | 4 | 0 | 0 | 61 | 17 | 0 | 3 | 0 | 56 | 30 | 5 | 0 | 1 | 59 | 18 | 4 | 0 | 0 | ||||||||||||
| Description | UoM | 2020 | 2019 | 2018 | 2017 | 2016 | 2015 | GRI Indicator | ||||||||||
| Women | Men | Women | Men | Women | Men | Women | Men | Women+Men | Women+Men | |||||||||
| Number of fatal accidents at work involving ORLEN Group employees | number | 0 | 0 | 0 | 0 | 0 | 0 | 0 | 0 | 44 | 34 | GRI 403-9 | ||||||
| Number of minor accidents at work involving ORLEN Group employees | number | 4 | 78 | 7 | 41 | 4 | 37 | 5 | 42 | 0 | 1 | |||||||
| Total number of accidents at work involving ORLEN Group employees | number | 4 | 78 | 7 | 41 | 4 | 38 | 5 | 42 | 44 | 45 | |||||||
| Description | UoM | 2020 | 2019 | 2018 | 2017 | 2016 | 2015 | GRI Indicator | |||||||||||||||||
| Poland | Czech Republic | Lithuania | Germany | Canada | Poland | Czech Republic | Lithuania | Germany | Canada | Poland | Czech Republic | Lithuania | Germany | Canada | Poland | Czech Republic | Lithuania | Germany | Canada | ||||||
| Number of fatal accidents at work involving ORLEN Group employees | number | 0 | 0 | 0 | 0 | 0 | 0 | 0 | 0 | 0 | 0 | 0 | 0 | 0 | 0 | 0 | 0 | 0 | 0 | 0 | 0 | Reported since 2017 | GRI 403-9 | ||
| Number of minor accidents at work involving ORLEN Group employees | number | 63 | 15 | 4 | 0 | 0 | 33 | 13 | 0 | 2 | 0 | 27 | 12 | 2 | 0 | 0 | 30 | 14 | 3 | 0 | 0 | ||||
| Total number of accidents at work involving ORLEN Group employees | number | 63 | 15 | 4 | 0 | 0 | 33 | 13 | 0 | 2 | 0 | 27 | 13 | 2 | 0 | 0 | 30 | 14 | 3 | 0 | 0 | ||||
| Description | UoM | 2020 | 2019 | 2018 | 2017 | 2016 | 2015 | GRI Indicator | |||||||||
| Women | Men | Women | Men | Women | Men | Women | Men | Women | Men | ||||||||
| Number of fatal accidents at work involving ORLEN Group contractors | number | 0 | 0 | 0 | 0 | 0 | 6 | 0 | 0 | 0 | 0 | Reported since 2015 | GRI 403-9 | ||||
| Number of minor accidents at work involving ORLEN Group contractors | number | 6 | 17 | 16 | 17 | 18 | 18 | 10 | 21 | 9 | 18 | ||||||
| Total number of accidents at work involving ORLEN Group contractors | number | 6 | 17 | 16 | 17 | 18 | 32 | 10 | 24 | 10 | 19 | ||||||
| Description | UoM | 2020 | 2019 | 2018 | 2017 | 2016 | 2015 | GRI Indicator | |||||||||||||||||
| Poland | Czech Republic | Lithuania | Germany | Canada | Poland | Czech Republic | Lithuania | Germany | Canada | Poland | Czech Republic | Lithuania | Germany | Canada | Poland | Czech Republic | Lithuania | Germany | Canada | ||||||
| Number of fatal accidents at work involving ORLEN Group contractors | number | 0 | 0 | 0 | 0 | 0 | 0 | 0 | 0 | 0 | 0 | 0 | 6 | 0 | 0 | 0 | 0 | 0 | 0 | 0 | 0 | Reported since 2017 | GRI 403-9 | ||
| Number of minor accidents at work involving ORLEN Group contractors | number | 17 | 6 | 0 | 0 | 0 | 28 | 4 | 0 | 1 | 0 | 29 | 6 | 0 | 0 | 1 | 28 | 3 | 0 | 0 | 0 | ||||
| Total number of accidents at work involving ORLEN Group contractors | number | 17 | 6 | 0 | 0 | 0 | 28 | 4 | 0 | 1 | 0 | 29 | 17 | 3 | 0 | 1 | 29 | 4 | 1 | 0 | 0 | ||||
Severity rates and number of dayslost due to post-accident absenteeism at the ORLEN Group
| Description | UoM | 2020 | 2019 | 2018 | 2017 | 2016 | 2015 | GRI Indicator | |||||||||||
| Number of days lost due to post-accident absenteeism at the ORLEN Group ***** | number | Total | Women | Men | Total | Women | Men | Total | Women | Men | Total | Women | Men | Total | Total | GRI 403-9 | |||
| number | 43.22 | 97.25 | 40.45 | 56.27 | 21.43 | 62.22 | 64.71 | 105.5 | 60.42 | 60.23 | 71.8 | 58.86 | 49.6 | 75.39 | |||||
| Description | UoM | 2020 | 2019 | 2018 | 2017 | 2016 | 2015 | GRI Indicator | |||||||||||||||
| Severity rates for accidents at work involving ORLEN Group employees***** | number | Total | Polska | Czechy | Litwa | Niemcy | Kanada | Total | Polska | Czechy | Litwa | Niemcy | Kanada | Total | Polska | Czechy | Litwa | Niemcy | Kanada | Total | Total | Total | GRI 403-9 |
| number | 43.22 | 41.95 | 44.00 | 60.25 | 0 | 0 | 56.27 | 51.42 | 73.38 | 0 | 25 | 0 | 64.71 | 60.15 | 71.23 | 84 | 0 | 0 | 60.23 | 49.6 | 75.39 | ||
*****Quotient of the number of days lost due to post-accident absenteeism of ORLEN Group employees and the number of accidents at work involving ORLEN Group employees, acknowledged by the employer and resulting in the employee's taking sick leave.
Number of days lost duepost-accident absenteeism at the ORLEN Group ******
| Description | UoM | 2020 | 2019 | 2018 | 2017 | 2016 | 2015 | GRI Indicator | |||||||||||
| Number of days lost due to post-accident absenteeism at the ORLEN Group ***** | number | Total | Women | Men | Total | Women | Men | Total | Women | Men | Total | Women | Men | Total | Total | GRI 403-9 | |||
| number | 3,544 | 389 | 3,155 | 2,701 | 150 | 2,551 | 2,718 | 422 | 2,296 | 2,831 | 359 | 2,472 | 2,232 | 3,317 | |||||
| Description | UoM | 2020 | 2019 | 2018 | 2017 | 2016 | 2015 | Wskaźnik GRI | |||||||||||||||
| Number of days lost due to post-accident absenteeism at the ORLEN Group ***** | number | Total | Poland | Czech Republic | Lithuania | Germany | Canada | Total | Poland | Czech Republic | Lithuania | Germany | Canada | Total | Poland | Czech Republic | Lithuania | Germany | Canada | Total | Total | Total | GRI 403-9 |
| number | 3,544 | 2,643 | 660 | 241 | 0 | 0 | 2,701 | 1,697 | 954 | 0 | 50 | 0 | 2,718 | 1,624 | 926 | 168 | 0 | 0 | 2,831 | 2,232 | 3,317 | ||
***** Number of days on which ORLEN Group companies’ employees were on sick leaves in a given period as a result of an accident at work acknowledged by the employer.
Number of occupational disease casesin each employee group******
| Description | UoM | 2020 | 2019 | 2018 | 2017 | 2016 | 2015 | GRI Indicator | ||||||
| Office and administrative staff | number | 0 | 0 | 0 | 0 | 0 | 0 | GRI 403-10 | ||||||
| Higher-rank and mid-level technical staff | number | 0 | 0 | 0 | 0 | 0 | 0 | |||||||
| Operators of process units and equipment | number | 1 | 2 | 1 | 3 | 4 | 2 | |||||||
| Repair and maintenance employees | number | 2 | 2 | 1 | 0 | 2 | 3 | |||||||
| Transport and storage employees | number | 0 | 1 | 1 | 0 | 0 | 1 | |||||||
| Total | number | 3 | 5 | 3 | 3 | 6 | 6 | |||||||
| List of companies | ORLEN Lietuva (2), UNIPETROL Group (1) | Public Company ORLEN Lietuva (5) | Public Company ORLEN Lietuva (2), UNIPETROL RPA,s.r.o.(1) | Public Company ORLEN Lietuva (3) | Public Company ORLEN Lietuva (6) | PKN ORLEN S.A.(1), Public Company ORLEN Lietuva (3), PARAMO,a.s. (1) ANWIL S.A.(1) | ||||||||
****** Number of acknowledged occupational disease cases is the number of decisions issued by the State Sanitary Inspector to confirm recognition of an occupational disease of a current or former employee of an ORLEN Group company.
Accidents at work involving ORLEN Group employeesby type of injury
| Opis | UoM | 2020 | 2019 | 2018 | 2017 | 2016 | 2015 |
| cuts | % | 20.48 | 18.75 | Reported since 2020 | |||
| bruises | % | 15.66 | 16.67 | ||||
| burns | % | 13.25 | 10.42 | ||||
| fractures | % | 10.84 | 14.58 | ||||
| dislocations and sprains | % | 32.53 | 25.00 | ||||
| other | % | 7.23 | 14.58 | ||||
Accidents at work involving ORLEN Group contractorsby type of injury
| Description | UoM | 2020 | 2019 | 2018 | 2017 | 2016 | 2015 |
| cuts | % | 26.09 | 12.12 | Reported since 2020 | |||
| bruises | % | 21.74 | 12.12 | ||||
| burns | % | 4.35 | 9.09 | ||||
| fractures | % | 30.43 | 15.15 | ||||
| dislocations and sprains | % | 13.04 | 24.24 | ||||
| other | % | 4.35 | 27.27 | ||||
Accidents at work involving ORLEN Group employeesby type of activity
| Description | UoM | 2020 | 2019 | 2018 | 2017 | 2016 | 2015 |
| day-to-day operation of plant and equipment | % | 20.73 | 25.00 | Reported since 2020 | |||
| movement | % | 40.24 | 41.67 | ||||
| plant engineering, maintenance and repairs | % | 23.17 | 14.58 | ||||
| road collisions | % | 7.32 | 6.25 | ||||
| other activities | % | 8.54 | 12.50 | ||||
Accidents at work involving ORLEN Group contractorsby type of activity
| Description | UoM | 2020 | 2019 | 2018 | 2017 | 2016 | 2015 |
| day-to-day operation of plant and equipment | % | 8.70 | 6.06 | Reported since 2020 | |||
| movement | % | 17.39 | 18.18 | ||||
| plant engineering, maintenance and repairs | % | 8.70 | 18.18 | ||||
| road collisions | % | 8.70 | 0.00 | ||||
| other activities | % | 56.52 | 57.58 | ||||
Number of emergenciesat the ORLEN Group:
| Description | 2020 | 2019 | 2018 | 2017 | 2016 | 2015 | GRI Indicor | ||||||||||||
| Poland | Czech Republic | Lithuania | Poland | Czech Republic | Lithuania | Poland | Czech Republic | Lithuania | Poland | Czech Republic | Lithuania | Polska | Czech Republic | Lithuania | Polska | Czech Republic | Lithuania | ||
| TIER1 | 1 | 4 | 0 | 0 | 7 | 1 | 2 | 4 | 0 | 1 | 4 | 0 | 3 | 0 | 0 | 1 | 4 | 0 | GRI OG-13 |
| TIER2 | 1 | 6 | 1 | 2 | 2 | 0 | 3 | 2 | 1 | 7 | 6 | 0 | 4 | 9 | 1 | 3 | 2 | 0 | |
| TIER3 – Production | 87 | 0 | 16 | 59 | 1 | 10 | 80 | 0 | 14 | 47 | 0 | 22 | 30 | 0 | 25 | 43 | 4 | 19 | |


