SUMMARY OF STRATEGY IMPLEMENTATION IN 2020
In 2019–2020, the ORLEN Group consistently pursued its strategic objectives a mid headwinds created by the COVID-19 pandemic.
Despite the adverse macro impacts, lower key margins (see table below) and lower sales volumes, reflecting subdued demand, the average 2019–2020 LIFO EBITDA was PLN 10.8bn, 0.5bn above the our Medium-term Plan.
Our earnings and stable financial condition, confirmed by safe levels of debt ratios and Baa2 rating from Moody’s, translated into an increase in CAPEX of PLN 0.4bn. On average, we spent PLN 7.2bn on investments, including projects to build the Polyethylene 3 unit at Unipetrol and a metathesis unit in Płock, purchase of shares in the Energa Group, and capacity additions under the Petrochemicals Development Programme.
The adverse impacts of the coronavirus pandemic and an ambitious CAPEX plan aimed at increasing the Group’s value necessitated a downward revision of the dividend payout for 2020 to PLN 1.00 per share. In line with the ORLEN2030 strategy adopted in November 2020, we plan to resume the pre-COVID-19 dividend policy, which means paying dividends of at least PLN 3.50 per share and maintaining or increasing the distributions in the coming years.

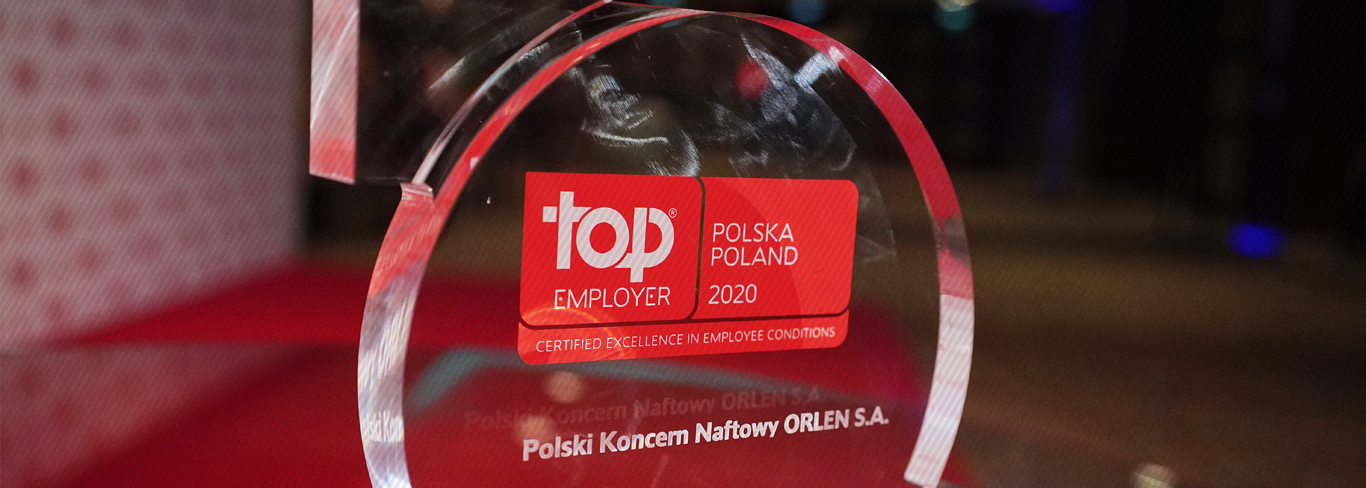
In 2020, PKN ORLEN was again awarded the titles of ‘The World’s Most Ethical Company 2020’ and ‘Top Employer Polska 2020’.
| Item | Actual 2020 | Medium-term Plan 2019–2020 | Difference |
| Model downstream margin [USD/bbl] | 7.3 | 13.5 | -6.2 |
| Model refining margin [USD/bbl] | 2.2 | 5.5 | -3.3 |
| Urals-Brent differential [USD/bbl] | 0.6 | 3.1 | -2.5 |
| Model petrochemical margin [EUR/t] | 839 | 808 | +31 |
Key success factors for the strategy
|
|
UoM |
Actual |
Actual |
|
Financial KPIs |
|||
|
LIFO EBITDA before impairment1,2, including: |
PLN bn |
12.4 |
9.2 |
|
Refining |
PLN bn |
(0.2) |
2.8 |
|
Petrochemicals |
PLN bn |
2.1 |
2.3 |
| Energy | PLN bn | 7.4 | 1.6 |
|
Retail |
PLN bn |
3.2 |
3.0 |
|
Upstream |
PLN bn |
0.3 |
0.3 |
|
Financial leverage |
% |
31.0 |
6.3 |
|
Net debt/LIFO EBITDA (before impairment losses) |
X |
1.02 |
0.28 |
|
KPIs – Refining, Petrochemicals and Power Generation |
|||
|
Share of Polish fuel market3 |
% |
54 |
56 |
|
Refining capacity utilisation |
% |
84 |
96 |
|
Olefins production capacity utilisation |
% |
76 |
79 |
|
Crude throughput at the ORLEN Group |
million tonnes |
29.5 |
33.9 |
|
Fuel yield at PKN ORLEN |
% |
82 |
84 |
|
Net electricity generation |
TWh |
8.9 |
8.6 |
| Electricity generation from renewable sources | TWh | 0.8 | 0 |
|
KPIs – Retail |
|||
|
Share of fuel sales in home markets3 |
% |
15.7 |
16.4 |
|
Sales per service station |
million litres |
4.0 |
4.4 |
|
Number of service stations effectively in operation1 |
X |
2,807 |
2,780 |
|
KPIs − Upstream |
|||
|
Hydrocarbon production |
mboe/year |
6.6 |
6.7 |
|
Hydrocarbon reserves |
mboe |
190.2 |
197.3 |
|
Number of new wells (net) |
X |
8.6 |
19.6 |
1) The operating results for 2020 and 2019 include impairment losses on assets of PLN (1.6) bn and PLN (0.2) bn.
2) The Power Generation segment’s LIFO EBITDA includes a PLN 4.1 bn gain on the bargain purchase of Energa shares.
3) End of year data.


