ABOUT THE ORLEN GROUP
According to the CEE TOP 500 report published by Coface, currently the ORLEN Group is one of the largest corporations in Central and Eastern Europe in terms of revenue. In line with the new Strategy 2030 adopted in November 2020, the ORLEN Group's ambition is to be an active leader of energy transition in Poland and Central Europe.
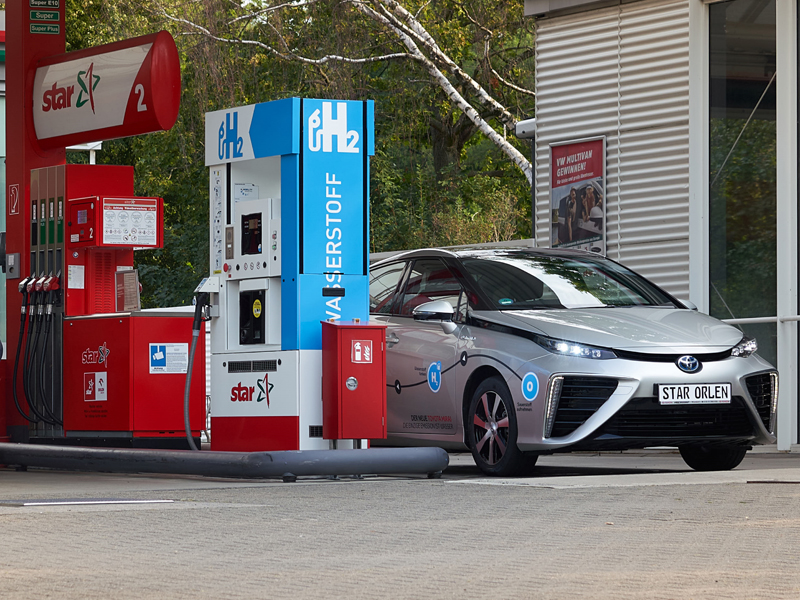
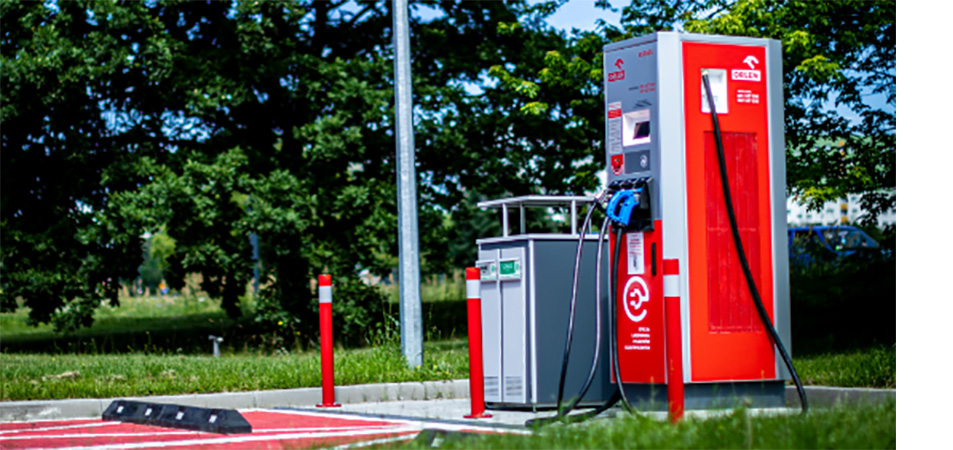
The ORLEN Group's core business consists in the production and distribution of electric energy, crude oil processing, and production of fuels, petrochemical and chemical products, as well as sale of the Group's products on the retail and wholesale markets. The ORLEN Group is also engaged in hydrocarbon exploration, appraisal and production. The ORLEN Group is one of Poland's largest electricity distributors, operating an electricity grid with a total length of 191 thousand kilometres, covering approximately one-fourth of the territory of Poland. At the end of 2020 ORLEN Group managed 2,855 fuel stations. In 2020, PKN ORLEN acquired RUCH, Poland’s countrywide newsagent chain. Based on the chain of 1,209 RUCH newsagents, the Company will expand its range of stores and catering services beyond service stations. As at the end of 2020, the Group had a network of 114 electric vehicle charging stations. In 2020, the segments with the largest contribution to the ORLEN Group's consolidated EBITDA were Energy and Retail, each of which accounted for approximately 40% of the Group's total profit. The ORLEN Group companies' business also includes services: crude oil and fuel storage, transport, repair and maintenance services, laboratory, security, design, administrative, insurance and financial services.
A significant portion of the ORLEN Group's fuel output is sold through own retail network located in Poland, Germany, the Czech Republic, Slovakia and Lithuania.
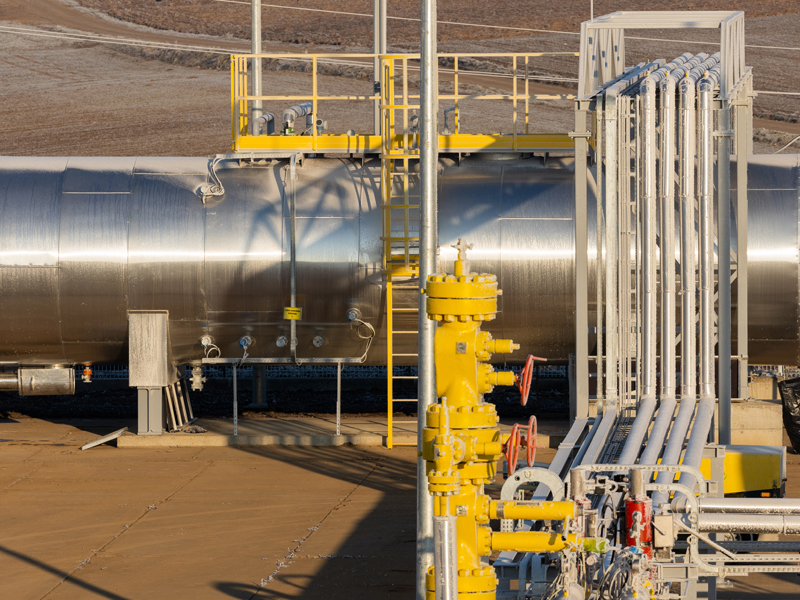
The ORLEN Group's retail network is supported by wholesale and logistics infrastructure consisting of above- and underground storage tanks and long-distance pipelines.
Interactive mapof the ORLEN Group's Assets
Selected financial-operating highlights of 2019-2020
|
Item |
unit |
2020 |
2019 |
|
I. MACROECONOMIC DATA (average value for the period) |
|||
|
Brent oil |
USD/bbl |
41.8 |
64.2 |
|
Ural oil |
USD/bbl |
41.7 |
63.0 |
|
WTI oil |
USD/bbl |
39.2 |
57.0 |
|
Ural/Brent differential1 |
USD/bbl |
0.6 |
0.8 |
|
Natural gas |
PLN/MWh |
53 |
69 |
|
Electric Energy |
PLN/MWh |
209 |
230 |
|
Emission allowances |
EUR/t |
24.8 |
24.8 |
|
Model Downstream margin1 |
USD/bbl |
7.3 |
10.7 |
|
Model refining margin1 |
USD/bbl |
2.2 |
5.2 |
|
Model petrochemical margin1 |
EUR/t |
839 |
859 |
|
Average exchange rate USD/PLN |
PLN |
3.8978 |
3.8399 |
|
Average exchange rate EUR/PLN |
PLN |
4.4449 |
4.2988 |
|
Average exchange rate EUR/USD |
USD |
1.1404 |
1.1195 |
|
II. OPERATING ACTIVITY |
|||
|
Sales of products and goods, including: |
‘000 |
38,260 |
43,293 |
|
Refinery |
‘000 |
23,560 |
27,553 |
|
Petrochemicals |
‘000 |
5,106 |
5,187 |
|
Retail |
‘000 |
8,852 |
9,817 |
|
Upstream |
‘000 |
742 |
736 |
|
Production, sales and distribution of electric energy, including: |
|
|
|
|
Net electric energy production |
TWh |
8.9 |
8.6 |
|
Electric energy production from RES |
TWh |
0.8 |
0.0 |
|
External wholesale |
TWh |
5.0 |
4.6 |
|
External retail sale |
TWh |
1.2 |
1.1 |
|
External distribution |
TWh |
0.7 |
0.7 |
|
Crude oil throughput in the ORLEN Group, of which: |
‘000 |
29,485 |
33,879 |
|
Crude oil throughput in PKN ORLEN |
‘000 |
15,306 |
16,207 |
|
Crude oil throughput in the Unipetrol Group |
‘000 |
6,076 |
7,854 |
|
Crude oil throughput in the ORLEN Lietuva Group |
‘000 |
7,847 |
9,515 |
|
III. FINANCIAL ACTIVITY |
|||
|
3.1. Consolidated statement of profit or loss and other comprehensive income |
|||
|
Sales revenues |
mln PLN |
86,180 |
111,203 |
|
Profit from operations under LIFO2 increased by depreciation and amortization3 |
mln PLN |
12,410 |
9,172 |
|
Refinery |
mln PLN |
(237) |
2,783 |
|
Petrochemicals |
mln PLN |
2,077 |
2,314 |
|
Energy |
mln PLN |
7,440 |
1,570 |
|
Retail |
mln PLN |
3,232 |
3,045 |
|
Upstream |
mln PLN |
322 |
295 |
|
Corporate Functions |
mln PLN |
(424) |
(835) |
|
Profit from operations under LIFO increased by depreciation and amortization |
mln PLN |
10,819 |
8,993 |
|
LIFO effect2 |
mln PLN |
(2,374) |
(131) |
|
rofit from operations increased by depreciation and amortization (“EBITDA2”) |
mln PLN |
8,445 |
8,862 |
|
Depreciation and amortization |
mln PLN |
4,537 |
3,497 |
|
Profit / (loss) from operations (“EBIT2”) |
mln PLN |
3,908 |
5,365 |
|
Net profit / (loss) |
mln PLN |
2,825 |
4,298 |
|
Profit/(Loss) attributable to shareholders of the Parent Company per share (EPS2) |
PLN/share |
6.44 |
10.05 |
|
3.2. Consolidated statement of financial position |
|||
|
Total assets |
mln PLN |
83,827 |
71,202 |
|
Equity |
mln PLN |
42,379 |
38,607 |
|
3.3. Consolidated statement of cash flows |
|||
|
Net cash from operating activities |
mln PLN |
7,247 |
9,319 |
|
Net cash used in investing activities, including: |
mln PLN |
(8,495) |
(3,994) |
|
Increase in non-current assets |
mln PLN |
8,992 |
5,457 |
|
Free cash flow4 |
mln PLN |
(1,248) |
5,325 |
|
Net cash used in financial activities |
mln PLN |
(3,711) |
(3,363) |
|
Dividends paid |
mln PLN |
(428) |
(1,497) |
|
Item |
unit |
2020 |
2019 |
|
3.4. Basic ratios2) |
|||
|
Liquidity ratios, including: |
|||
|
Current liquidity ratio |
x |
1.1 |
1.7 |
|
Quick liquidity ratio |
x |
0.5 |
0.9 |
|
Turnover ratios, including: |
|||
|
Receivables turnover |
days |
34 |
29 |
|
Liabilities turnover |
days |
34 |
28 |
|
Inventory turnover |
days |
58 |
48 |
|
Profitabilities ratios, including: |
|||
|
Return on assets (ROA) |
% |
4.8 |
6.2 |
|
Return on equity (ROE) |
% |
9.4 |
11.5 |
|
Return on capital employed (ROACE) |
% |
9.2 |
10.9 |
|
Return on capital employed under LIFO (ROACE LIFO) |
% |
13.2 |
11.2 |
|
Gross margin on sales |
% |
5.2 |
5.0 |
|
Net margin on sales |
% |
4.8 |
4.0 |
|
Debt ratios, including: |
|||
|
Net debt |
mln PLN |
13,120 |
2,448 |
|
Net debt / EBITDA |
x |
1.27 |
0.27 |
1) For the calculation formula, see Glossary.
2) For definitions of financial parameters and indicators as well as a description of the LIFO method of inventory valuation, see Glossary.
3) The operating results in 2019 and 2020 include impairment losses of PLN (179) million and PLN (1,591) million, respectively.
4) Free cash flow = net cash from operating activities + net cash from investing activities.
.jpg)


